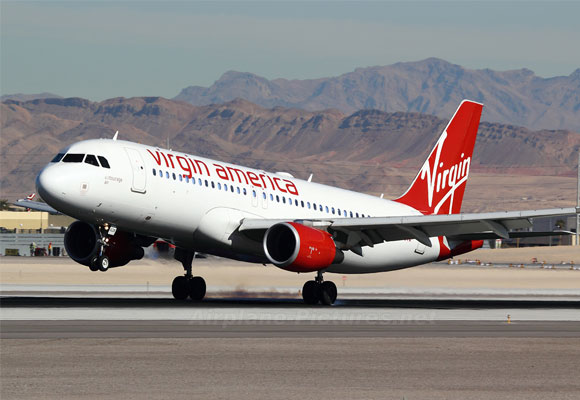
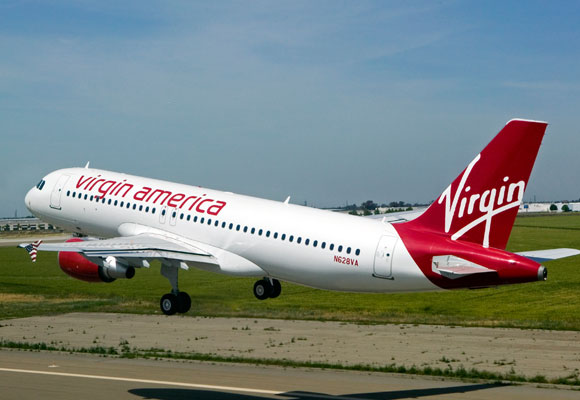
Record Annual Earnings For Virgin America
The Company expects capacity, as measured by available seat miles, to increase by approximately 2.0 percent to 3.0 percent for the Q12015 vs Q114.
«2014 was a remarkable year for Virgin America on every front», said David Cush, Virgin America’s President and Chief Executive Officer. «We achieved record profitability and significantly strengthened our balance sheet by going public in the second largest airline IPO in history. Both our existing and new investors have shown confidence in our low-cost, high-amenity business model – and we’ve continued to sweep the major travel awards for both operational excellence and our innovative service. Importantly, we’ve also continued to exceed the industry average in Revenue per Available Seat Mile (RASM) growth and also shown a significant RASM premium on some of the nation’s most competitive business routes. Our 2014 results are a credit to both our guest-focused Teammates and a consistent, award-winning product».
Total operating revenue of $372.2 million, an increase of 3.4 percent over the fourth quarter of 2013. Revenue per Available Seat Mile (RASM): RASM increased 3.7 percent compared to the fourth quarter of 2013, to 12.23 cents. Year-over-year RASM growth was driven by a 2.7 point increase in load factor, offset partially by a 1.8 percent decline in yield, and also by a 25.5 percent growth in other revenue attributable to Virgin America’s new co-branded credit card agreement that was implemented in early 2014 and strength in other ancillary products.
Cost per Available Seat Mile (CASM): Total CASM excluding special items increased 0.7 percent compared to the fourth quarter of 2013, to 11.10 cents. CASM excluding special items, fuel costs and profit sharing for the quarter increased 4.2 percent year-over-year, to 7.16 cents. Fuel Expense: Virgin America realized an average economic fuel cost per gallon including taxes and the impact of hedges of $2.87, which was 8.9 percent lower year-over-year. This amount excludes $2.8 million of mark-to-market costs for fuel hedges that will mature in 2015 and which did not qualify for hedge accounting treatment.
Operating Income: Fourth quarter 2014 operating income excluding special items increased by 45.1 percent over the fourth quarter of 2013 to $34.2 million. The Company’s operating margin excluding special items of 9.2 percent improved by 2.6 points year-over-year. Net income excluding special items for the fourth quarter increased 98.4 percent year-over-year, to $28.1 million. The Company’s IPO and related reduction in outstanding debt resulted in a $3.2 million decrease in net interest and other expense, contributing to the strong improvement in net income.
Fully Diluted EPS: Fully diluted earnings per share was $0.16 for the fourth quarter of 2014 on a GAAP basis. Excluding special items, fourth quarter 2014 fully diluted earnings per share was $1.16. Capacity: Available seat miles (ASMs) for the fourth quarter of 2014 decreased 0.3 percent year-over-year. The airline ended the quarter with 53 Airbus A320-family aircraft. Liquidity: Unrestricted cash was $394.6 million as of December 31, 2014.
Fourth Quarter 2014 Pro Forma Diluted Earnings per Share.
Virgin America’s capital structure and number of common shares outstanding were materially changed in November 2014, upon completion of its IPO. The fully diluted share count for the fourth quarter of 2014 determined on a GAAP basis reflects the weighted average of common stock outstanding prior to the offering and subsequent to the offering. On a pro forma basis as if the offering had occurred prior to October 1, 2014, fourth quarter 2014 fully diluted earnings per share excluding special items would have been $0.71, based on a fully diluted share count of 44.6 million shares and net income excluding special items available to common shareholders of $31.6 million. Virgin America is providing this pro forma information to present a more meaningful basis of comparison for fully diluted earnings per share in future periods.
The Company expects capacity, as measured by available seat miles, to increase by approximately 2.0 percent to 3.0 percent for the first quarter of 2015 as compared to the first quarter of 2014. Based on current revenue trends, the Company expects PRASM to change between -1.0 percent and +1.0 percent versus the first quarter of 2014. The Company expects CASM excluding fuel and profit sharing to increase between +1.0 percent and +3.0 percent versus the first quarter of 2014.
Based on Virgin America’s hedge portfolio and current market prices for aviation fuel products, the Company expects Virgin America’s economic fuel cost per gallon inclusive of related taxes and hedge costs to average between $2.45 and $2.55 for the first quarter of 2015. This number may change depending on fluctuations in market prices for jet fuel during the quarter. Virgin America (NASDAQ: VA) reported its financial results for the fourth quarter and full year 2014 last week.